
Defensive assets
Bonds play an important role in most investors’ portfolios, providing more certain outcomes than equities for more cautious investors at the price of lower returns, and downside protection at times of equity market trauma for more adventurous investors. Bonds however, are not all the same as they range from being cash like to the other extreme of being more like equities. So, the choices that an investor makes when choosing bonds are important.
Let’s take a look at the three key choices in turn.
16th June 2023
-
 Gavin Jones See profile
Over time, the return that you receive from owning bonds is closely related to the yield-to-maturity at the time you buy them. If you hold a bond to its maturity date, that is the return you will receive assuming all coupon (interest) payments are reinvested. Using UK Government bond (gilt) data from 1970, we can run a simple analysis and look at the average yield-to-maturity of bonds from 1.5 years maturity up to 15 years. The results are plotted below, showing the income of a portfolio at each chosen maturity. As an example, 3-year maturity bonds on the chart have an average yield of just below 6.5% over the last 50 years, but looking at the 10-year bond it carries much great risk but has had a yield of only about 0.5% higher. What is evident is that there is very little yield pick-up from owning longer-dated bonds than shorter-dated bonds (around 1% p.a.), but the risk level picks up dramatically. Note that during this period the annualised volatility of returns (risk %) of global equities was measured at around 15%[1]. On this basis, 15-year bonds had around three-quarters of the risk of global equities compared to just over one-third for 5-year bonds.
Figure 1: Shorter-dated bonds have favourable risk-to-reward characteristics (1/1970-3/2023)
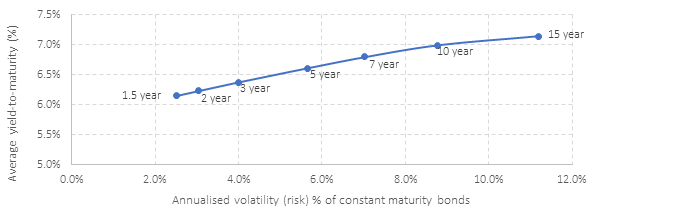
Source: Albion Constant Maturity Indices (ACMI). Yield data – Bank of England.
[1] Annualise volatility of returns represents the range either side of the (arithmetic) average return that two-thirds of outcomes fell. A high number represents a greater uncertainty of outcome than a lower number.
The roles that bonds play in both more cautious and more adventurous portfolios are primarily defensive. As you move away from the strongest borrowers, yields rise as borrowers become financially weaker. Investors who invest in these financially weaker bonds take on a greater degree of the risk and are compensated for this through a higher yield. Lower quality corporate bonds have an increasing correlation to the borrower’s equity, reflecting the risk of default on their debt. At times of equity market crisis – when weaker companies may be in trouble – higher quality bonds tend to perform better than lower quality bonds, providing a useful defensive holding in a portfolio, as the figure below illustrates. In the Global Financial Crisis, the red bar shows global equities fell by 33% before recovering. Holding global short dated bonds as your defensive assets in a portfolio, the dark blue bar, will have protected value, rising by 18%. But if you had chosen high yield bonds – the yellow bar, which have a lower credit quality those assets would also have fallen in value.
Figure 2: High quality bonds offer defensive qualities – Global Financial Crisis 11/07 to 2/09
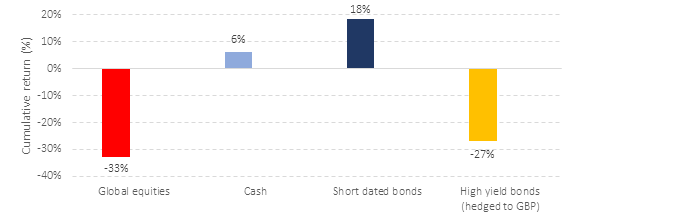
Data sources: Morningstar Direct © All rights reserved. Albion. Bank of England (refer to endnote)
Buying foreign bonds increases the choice of bonds for investors and diversifies the risk of interest rate movements across markets. A foreign bond comes with currency risk between the currency of issue (e.g., US dollars) and the base currency of the investor (e.g., Sterling for a UK investor). Currency exposure introduces an equity-like risk into the bond portion of portfolio, creating a volatile asset. Let’s run a quick experiment. For simplicity’s sake, imagine that you placed a deposit in US dollars for one month and rolled it over each month without hedging the currency, from 1990 to 2022. Imagine too, an alternative scenario where you hedged the US dollars back to GBP, in effect ending up with a synthetic GBP cash deposit, as the cost of hedging is calculated using the difference between the two interest rates (unfortunately there are few free lunches in investing!). The chart below reveals the material difference in annual outcomes. The orange bars represent the hedged interest rates and the blue bars, the unhedged interest rate. At times you would have been very happy with the unhedged return – in the Global Financial Crisis as sterling weakened this gave an equivalent interest rate of 40%. But this would be balanced by all the times the interest rate is negative – meaning the value of your deposit fell in value which is undesirable for defensive assets.
Figure 3: Currency adds material volatility to the equation (1990-2022)
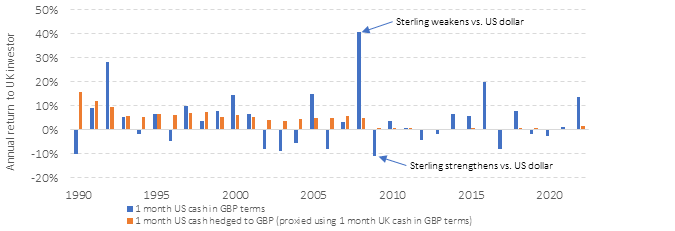
Data source: Federal Reserve and Bank of England.
Investors need to be able to talk themselves out of a sensible starting point of shorter-dated, higher-quality, currency-hedged bonds, when deciding what type of bonds to own.