
Growth assets
It is sometimes easy to forget that when markets rise and fall, we look at this through a highly diversified lens. In reality, the fortunes of individual companies and even sectors may be quite disparate over both the short and longer term.
16th June 2023
-
 Gavin Jones See profile
Take a look at the figure below that illustrates just how widely dispersed US stock outcomes have been year-to-date 2023 (to the end of April). Each bar represents the share price performance of one of the companies in the main US stock market, the S&P 500[1]. The S&P 500 itself is up by around 9% in USD terms (4% in GBP terms as Sterling has strengthened against the US dollar).
In the first quarter of 2023, the top ten contributors to performance accounted for 90% of the market rise, with Apple, Microsoft and Nvidia alone contributing to half of the rise. Yet in 2022 the top ten companies by size collectively fell 37% compared to the market fall of around 18%[2].
Figure 1: Individual US stock returns differ widely (YTD to 30/4/23)
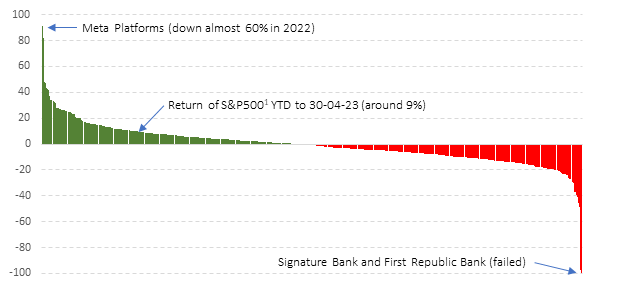
Source: Holdings data from Morningstar Direct © All rights reserved.
This can lead the unwary into thinking that it is easy to pick stocks (e.g., ‘It was obvious that Meta would rebound after last year’s plummet in share price!’). Nothing could be further from the truth.
Active investors who aim to beat the market through their stock-picking skills see charts like the one above and lick their lips at the opportunities they offer. If they can invest into the ‘winners’ and avoid the losers, there are attractive investment returns on offer. Yet in practice, over time these same investors often fail to beat the average market return, or even deliver the market return.
Passive investors on the other hand who believe that markets work well incorporating all public information into prices see the dangers of picking the wrong stocks and missing out on the returns that the market in aggregate delivers. They can, more-or-less, capture the market return with a high degree of certainty.
A research paper in 2018 titled ‘Do stocks outperform treasury bills?’[3] had the remarkable effect of being claimed by both the active and passive sides of the investing debate as evidence as to why their approach is valid. It identified that the US$32 trillion of wealth created between 1926 and 2015 in the US market, was entirely generated by the top 1,000 companies, or put another way, less than 4% of the total number of companies that had existed on the US stock exchanges. A follow-up paper[4] focusing on non-US markets found that over 60% of all stocks failed to deliver a return higher than US T-bills and less than 1% of companies delivered all of the wealth creation from 1990 to 2018. The author states (in his original paper):
‘Not only does diversification reduce the variance of portfolio returns, but non-diversified portfolios are subject to the risk that they will fail to include the relatively few stocks that, ex-post, generate large cumulative returns. Indeed, the results help to understand why active strategies, which tend to be poorly diversified, most often lead to underperformance.’
The challenge of structuring a highly active, concentrated portfolio to attempt to identify and capture the returns of these few wealth generating firms is immense and overlooks the power of the collective market view (‘it’s all in the price’). The active management industry’s track record of delivering on its promise to beat the market is well-documented and extremely poor, with over 95% failing to do so over a twenty-year period[5].
For those who accept that markets work, they can simply capture the market return through a low-cost, highly diversified systematic fund (of which index funds are a subset).
As the late, great John C. Bogle, the founder of Vanguard liked to say:
‘Don’t look for the needle, buy the haystack!’
[1] This represents the return of the Vanguard S&P500 ETF in USD
[2] Nasdaq, (2023) Top 10 Names in S&P 500 Responsible for 90% of Q1 Gains, April 05. https://www.nasdaq.com/articles/top-10-names-in-sp-500-responsible-for-90-of-q1-gains
[3] Bessembinder, H. (2018) Do stocks outperform Treasury bills? Journal of Financial Economics, vol. 129, no. 3, 440–457. https://doi.org/10.1016/J.JFINECO.2018.06.004
[4] Bessembinder, H. (Hank), Chen, T.-F., Choi, G. and Wei, K.-C. (John). (2019), Do global stocks outperform US treasury bills? SSRN Electronic Journal. https://doi.org/10.2139/SSRN.3415739
[5] SPIVA | S&P Dow Jones Indices. (2022) https://www.spglobal.com/spdji/en/research-insights/spiva/spiva-library/
We adopt this approach, preferring to diversify your investment portfolios widely rather than try and second guess which companies will do best. In theory if we capture this market return in line with your attitude to investment risk, we should naturally be above the average investor over time. Looking at the performance of portfolios from 2016 to date against similar multi asset managers the orange dots show the performance of each portfolio we have.
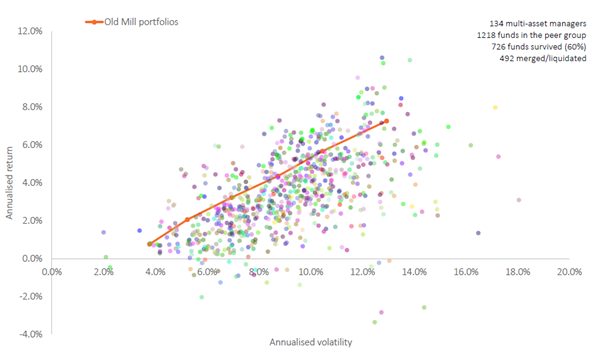
Source: Morningstar Direct
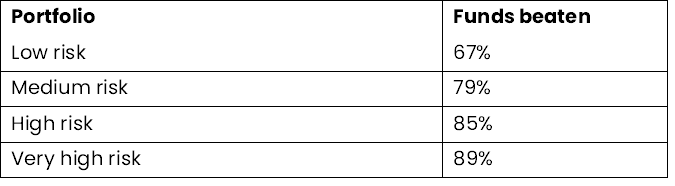
Comparing each portfolio’ against managers taking a similar risk the results are as follows:
We cannot control the outcomes, as we know markets are unpredictable and stock market crashes happen from time to time, but we remain confident in the ability of our portfolios to deliver a positive investment experience.