
Investing for the long term
At the start of 2024, the UK’s FTSE100 Index – which covers the top 100 stocks listed on the London Stock Exchange weighted by their market capitalisation – turned 40. It is the most commonly cited UK equity market index by the media, often referred to as the ‘Footsie’ or the ‘index of the leading 100 companies’. You will no doubt have heard news readers making somewhat meaningless statements such as the ‘The Footsie was up by 23 points today’. By and large they refer to the price index, which does not include dividends paid.
It took over from the FT30 in 1984 which was a subjectively selected portfolio of 30 companies equally weighted, which had been around since 1935. So, the story goes, 100 stocks were selected as it was a nice round number and also because it was the maximum number of securities that could fit on the screens of market terminals at the time!
13th February 2024
-
 Gavin Jones See profile
Over the last forty years the make-up and influence of the market has changed quite considerably. Several key statistics stand out:
Only around one third of the original FTSE100 constituent names remain today, even taking account of various reincarnations of firms following mergers and acquisitions[1]. Many original members of the index in 1984 have been taken over. For example, Allied Lyons saw a merger with Domecq in 1994 before being taken over by the French company Pernod Ricard. Boots was the first FTSE firm to be bought by private equity in 2007. Some companies went out of business – household names such as MFI Furniture who eventually closed in 2008 after failing to compete against rivals such as IKEA. Other companies, like Ladbrokes got relatively smaller and fell out of the index .
[1] Haill, O. (2024), FTSE 100 at 40 years old: how many of the original companies remain on the index? https://www.proactiveinvestors.co.uk/ accessed 17-01-2024.
While in 1984, many of the constituent companies derived much of their earnings from the UK, today the FTSE100 is made up of global companies where over 75% of their earnings come from overseas.
The other point of note is that in 1984 when the FTSE100 was born, the UK market represented ≈7-10% of global markets depending on how it was measured[1]. Today, that sits at around 4%. At the end of 2023 Apple Inc. had a market capitalisation larger than the whole of the UK stock market. Back in 1984, Apple had just launched the revolutionary Apple Mac and 40 years later the company is larger than the entire UK stock market. How the world has changed.
[1] The World Bank (2024) Market capitalization of listed domestic companies (current US$)
The FTSE100 provides a good case study of equity market characteristics. Over that time period[1] the index (no costs deducted) turned £100 into around £2,300 before inflation, or £790 after inflation, when dividends were reinvested (i.e. total return). That is a pretty good reward and in line with the long-term returns since 1900. Brave and patient investors were richly rewarded. The Retail Price Index (RPI) delivered 4.6% a year relative to average inflation of 2.9% for the period. Reinvested dividend income makes a material difference to outcomes.
The best performing company since 1984 was actually British American Tobacco, which delivered around 16% p.a. Those holding cash received about 1.8% p.a. after inflation, although since the start of the Global Financial Crisis (11/2007) holders of cash would have seen their purchasing power fall by over 25%. It is risky being a long-term holder of cash.
Figure 1: FTSE 100 vs inflation and developed market equities (1/1988 to 12/2023)
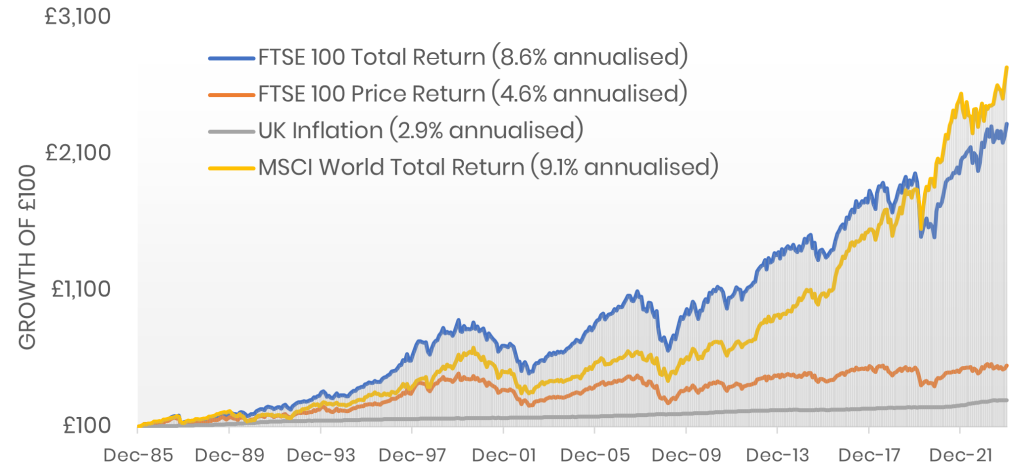
Source: Morningstar Direct © All rights reserved
As recently as the start of January 2020, £1 invested in the FTSE100 had the same value as £1 invested in global developed markets over the period under review. In the past three years, the so-called ‘Magnificent Seven’ mega-cap tech stocks have driven the performance of the global markets. Over the period from January 1986 to December 2023, the best annual return was 42% in 1989 and the worst was -28% in 2008 (although in total the market fell 40% from peak to trough). The worst month was October 1987 when the market fell 26% or so. Ouch!
Figure 2: FTSE 100 calendar year return distribution
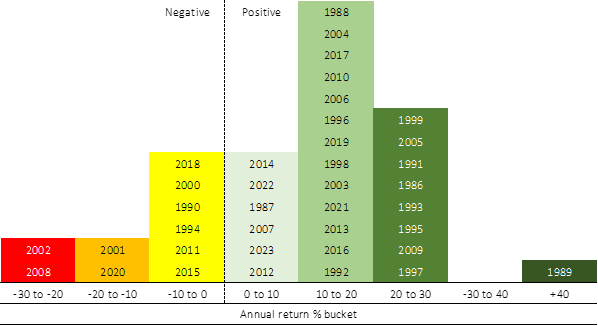
Source: Morningstar Direct © All rights reserved
Today there appears to be quite a bit of negative sentiment surrounding the structure of the UK equity market, which is in part driven by the relative surge in the value of US stocks over the past few years. In part this reflects the sector differences between the UK and the US market. For example, the UK has around 23% in financials, 12% in energy and just over 1% in technology companies, whereas for the US these numbers are 13% in financials, 4% in energy and a very material 29% in technology companies.
The performance of different sectors ebbs and flows, but it does make good sense to be globally diversified to ensure that you own a broad swathe of global capitalism. As you know we have written about this in the past and have been reducing the exposure you have in your portfolios to the UK stock market, before moving the developed equity market investments you have in line with the proportions in global stock markets to benefit from this diversification.
[1] Total return index data were only available from 01/1986