
Investment update
Investing, as we have often reported, is a long-term pursuit but while we look at shorter term performance in this publication regularly, how should you compare how we do with what you may achieve elsewhere?
8th September 2023
-
 Gavin Jones See profile
Evolution has meant our brains are poorly designed to be good investors. The parts of our brains that have evolved to promote survival instincts – such as fight and flight, fear and greed and an aversion to losses may all help us to survive but they can lead us into making very poor investment choices. For many investors, a propensity to place too much weight on recent events in terms of predicting what the future may look like is quite common. This is known a ‘recency bias’.
So as an investor, when you meet with your Old Mill financial planner for your annual review and the return you may have had over the last year is disappointing, it is entirely reasonable to question whether your portfolio is still the best place for your wealth. In the current climate of rising interest rates, investments benefiting from these short term rates such as the new 1 year bond from National Savings paying 6.2% can appear on the face of it to be very appealing.
As systematic investors[1], we seek to continually challenge our process in order to maintain an investment strategy which we regard as giving us the best ability to deliver a successful investment experience. We know that trying to predict the time and direction of market movements over shorter time periods is a fool’s errand. Any change in portfolio structure or investment approach, therefore, must be guided by a change in the evidence or our investment goals. The success of investing is measured over decades or even generations, not years and the process we have increases your chances of living the lifestyle you want.
[1] Systematic: ‘according to an agreed set of methods or organized plan’. Cambridge Dictionary
The interest rates set by central banks have been rising around much of the world in recent times. In the UK, the base rate set by the Bank of England was just 0.1% three years ago and now sits at 5.25%, at time of writing. This considerable increase – much of which happened in 2022 – led to historically low returns on bonds, as bonds fell in price in order to align with expected interest rates. Despite rates not having been at such levels for some time, it is not unchartered territory. In fact, since 1975 rates have been above current levels more than half of the time[1].
For investors with intermediate to longer term plans (i.e., 5-10 years and beyond) these rate rises, despite corresponding price falls, should have significant benefits. Given the structure of portfolios, the now higher yielding bonds should get through the price falls experienced and thereafter enjoy a higher return. It also opens up other options for savers – annuity rates and fixed term investments now become more appealing in some circumstances.
However, when it comes to the expected returns on portfolios, the evidence remains the same. We fundamentally believe that risk and return are related, and thus if the expected return on cash has risen on the back of interest rate rises, so must the expected return on all other (riskier) asset classes. If this did not happen, investors would simply own cash for a period of time before reentering capital markets. As supported by a huge body of evidence, we know it is impossible to get the timing of that right with any degree of certainty.
We can look at historical figures to give an insight into whether there is a relationship between current rates on cash and subsequent portfolio returns. The chart below illustrates – at a given level of starting interest rate – the number of times in the subsequent year a medium risk portfolio outperformed this starting cash rate. This covers a period of over 50 years. In essence, this is seeking to answer the question: ‘if I lock up my cash today for the next twelve months, I am guaranteed x%, so why take on the additional risk of investing in a portfolio?’. Note that anything above 50% implies the portfolio performed better than locking cash up. The cash rate used is represented by the yield on a 1-year UK government bond, with an additional 1% added to reflect the higher rates that might be achieved through other institutions offering fixed term cash accounts.
Proportion of years medium risk beats cash, locked in at a given rate – January 1970 to June 2023
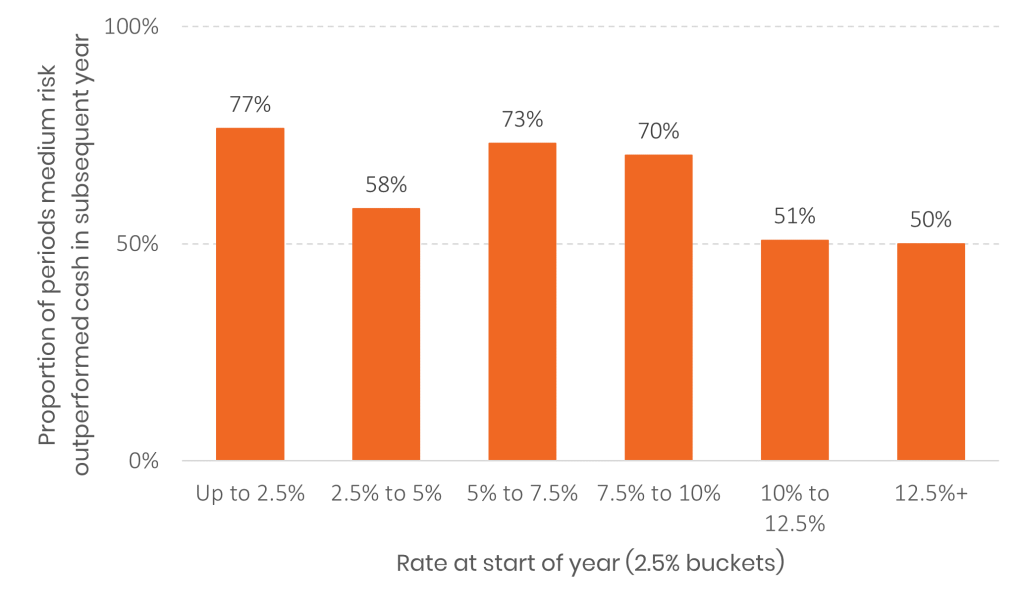
Data source: Morningstar Direct © All rights reserved. Bank of England. Monthly rolling 12-month periods used. ‘Cash’ return represented by 1-year gilt yield +1%.
So as an example, when the cash rate at the start of the year is between 5% and 7.5% a medium risk portfolio will have outperformed cash in the subsequent year, 73% of the time.
You will notice that there is no clear relationship between the level of cash rates and subsequent outcome of portfolio returns relative to cash but over all 1-year periods in the sample, the portfolio outperformed locked up cash in 2/3rds of observations. The average excess return of the portfolio over cash in the 1-year periods was 4%. Ensuring the money you keep easily accessible is earning a good rate of interest is sensible. Derailing your well thought out investment strategy by chasing short term rates could be very costly over the longer term.
Cash remains a very good home for emergency funds and short term capital expenditure and we recommend all our clients keep a certain level of cash.
Keeping higher level of cash does have its own implications. Locking up cash reduces liquidity, and may only be withdrawn outside of the agreed period with a significant penalty. For your investment portfolio, notwithstanding the value can go up or down, access is always possible at short notice. Also, savers with larger sums of cash need to consider spreading cash across banking groups to remain under the Financial Services Compensation Scheme (FSCS) protection limits. You can check what protection is available through the FSCS here. Bank failures in the US this year offer a cautious reminder to savers not to naively ignore protection limits. This in itself causes additional administration and hassle to open multiple deposits. Finally, the taxation of cash deposits, attracting Income Tax may mean more tax to pay. While dividend rates of tax are similar to cash, the level of Capital Gains Tax is typically half that of income. Income Tax also has to be paid each year while capital gains can be more easily controlled.
You can be forgiven for thinking that you can take advantage of the high short term cash rates currently on offer by selling long term investments to put into cash and then reinvest into markets after a year. There are a number of reasons we don’t think this is a good idea.
[1] Bank of England
We have covered before that investment returns do not come in straight lines. Investment falls can be followed by a period of swift and sharp recovery. Selling out to wait and see what happens can risk the long term returns you should expect from investing in riskier assets.
Most investors – at some time – will be either tempted to time when to be in or out of equity markets – or wish they had when markets fall. It would be great to be able to capture the upsides and avoid the downsides, but that is wishful thinking.
Investors may well underestimate the rapidity and magnitude of the movements that markets make, although the very material double digit daily moves around the Covid- crisis (March 2020) provided a useful lesson. In fact, a small number of days account for much of the market movement over time. Picking which days these are – either to be in or out of the markets – is virtually impossible and the chances of long-term success are extremely rare.
An analysis of missing the best days in the market from earlier in the year (Albion, 2023) provides some food for thought, as the chart below illustrates. This covers a 30 year period ending January 2023.
Missing the best few days in the markets could be very costly
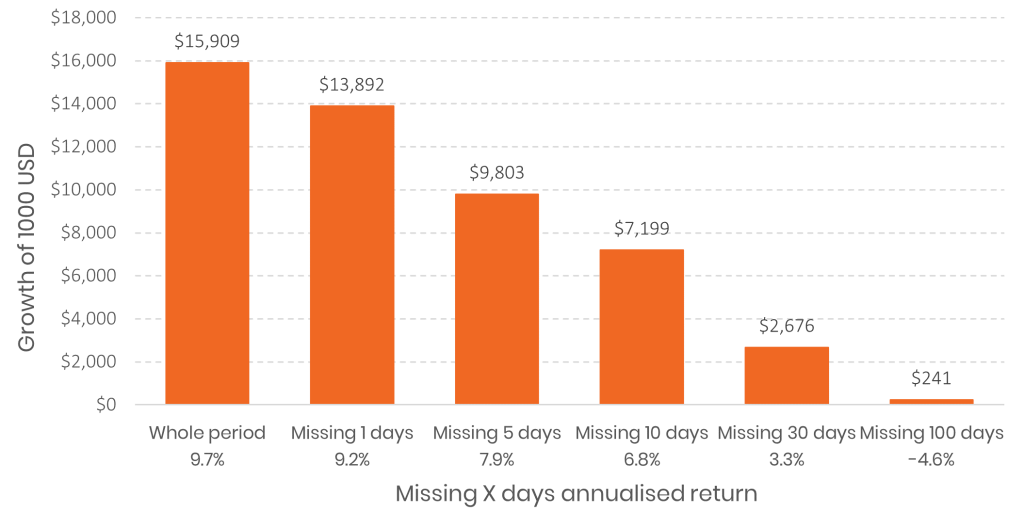
Source: Albion Strategic Consulting.
Data: Morningstar Direct © All rights reserved: SSgA SPDR ETF. Returns in USD. 23/01/1993 – 30/01/2023
Whilst these types of study imply a black and white approach to being invested in equities or cash, this is a somewhat unreal scenario. It is evident that a few good days, weeks or months drive the bulk of market returns and missing them can be costly. Missing the best 30 days in this 30-year period deliver only 17% of the rewards that the market delivered[1].
The October 2022 Liz Truss/Kwasi Kwarteng ‘mini-budget’ in the UK provided evidence of just how quickly new information can impact markets. Being right is quite a challenge. Being wrong can be very costly. The odds of success in market timing are slim.
[1] As an aside, the data used is from the first US ETF launched thirty years ago, almost to the day. It was revolutionary at the time for providing cheap and tradable (not necessarily a good thing!) access to the S&P500 index.
Whilst we cannot guarantee the returns for your investment portfolio, we can see how such a portfolio has performed in the past to give a range of possible returns in the future. Indicative one year returns in the last thirty years for a medium risk investor have ranged between a fall of 20% and a rise of 35%. Investing always carries a risk of loss but along with that possibility the rewards are that your investments could be much higher in a year’s time.
Risk and return remain inextricably linked. The expected return has increased for all asset classes.
When investments have fallen you could also ask whether the investment manager has done something to make them underperform other managers. One of the benefits of a systematic process such as ours is that it minimises the risk of not achieving the market return – we are investing into the asset class as best we can so we should expect the return of the asset classes we use.
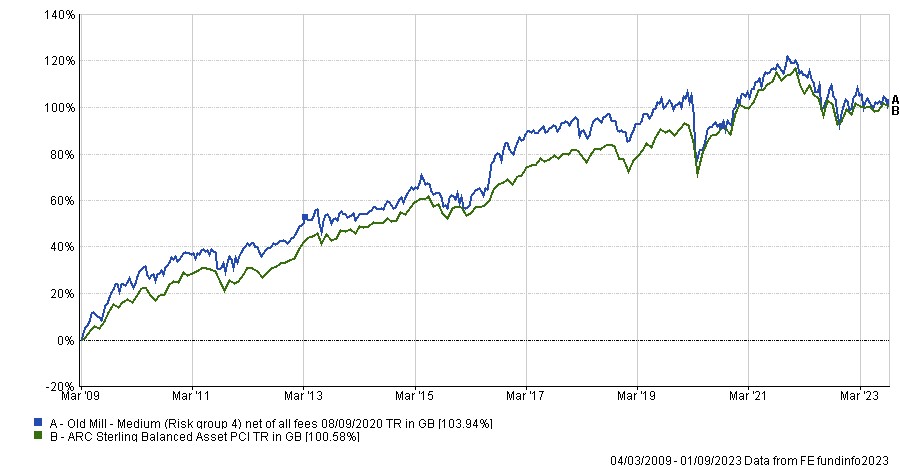
As part of our ongoing management of portfolios, we can also sense check the performance of our portfolios against our peers. As we have been running the Investment Portfolios for over ten years now, the Investment Committee use the Asset Risk Consultants’ Private Client Indices to measure our performance against other managers.
These are a set of private client indices designed by Asset Risk Consultants (ARC) to be used by private clients and their advisers in assessing the performance of any discretionary portfolio with a non-specialist mandate.
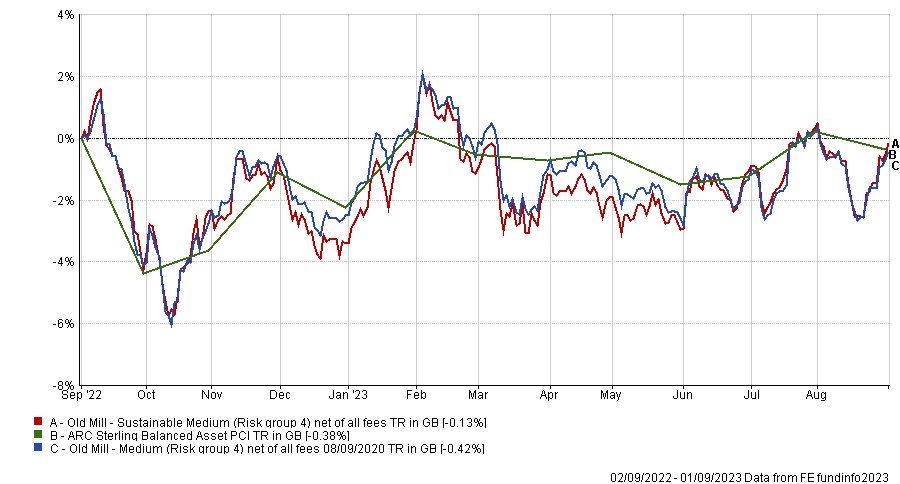
For a medium risk portfolio we compare against the ARC Sterling Balanced Asset Private Client Index. Looking at the last couple of years we can see comparable returns to other managers.
One year
Three years
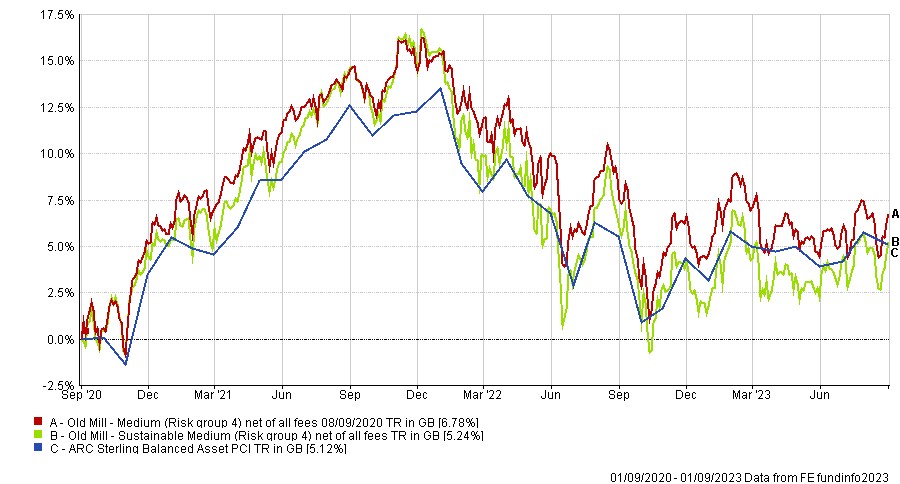
Since inception
You may recall from the June Insight, we showed the performance of portfolios from 2016 to date against similar multi asset managers where the orange dots show the performance of each portfolio we have. For reference we have included the information again below.
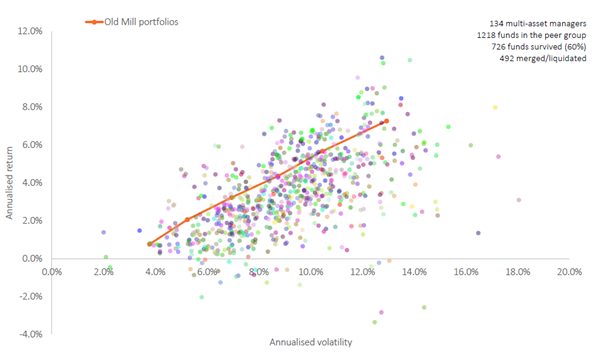
Source: Morningstar direct
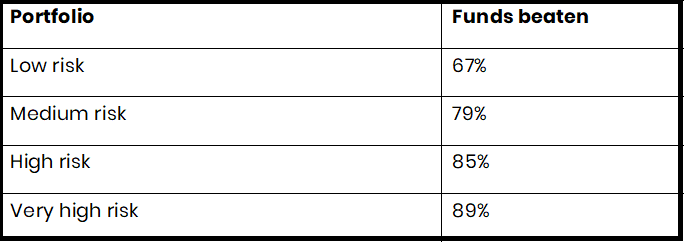
Comparing each fund against managers taking a similar risk the results are as follows:
It is always disappointing to see falls in investments but the returns we have experienced in the last few years have been well within the boundaries we discussed with you at outset. Investment volatility is a normal part of investing and experience shows that patience is ultimately rewarded.
Do speak to your Old Mill financial planner if you want to discuss your individual circumstances.