
Quarter two 2024 - Investment Performance report
12th July 2024
-
 Gavin Jones See profile
While we all like to think that we are capable of making rational decisions, it appears that when it comes to investing, a switch inside even the most sensible person seems to flick, and rationality disappears in a cloud of emotion.
Being an investor is not easy. We have to contend not only with the erratic and unpredictable nature of markets but also the sometimes erratic and irrational way in which we will be tempted to think and behave. All investors should try their best to make rational decisions and to make their head rule their heart. Yet for many, while understanding that being rational makes sense, putting it into practice can be exceedingly difficult. Benjamin Graham, one of the great investment minds of the twentieth century, famously stated:
‘The investor’s chief problem – and even his worst enemy – is likely to be himself.’
Irrational investing manifests itself in many different ways: chopping and changing one’s investment plan influenced by what has just happened to the markets, perhaps after an election result; trading shares in an online brokerage account; trying to pick market turning points, i.e. when to be in or out of different markets; being tempted into buying flavour of the month investment ideas or products; or chasing fund performance. The list of irrational decision-making opportunities is long and undistinguished. John Bogle summed this up perfectly in an address to the Investment Analysts Society of Chicago (2003):
‘If I have learned anything in my 52 years in this marvelous field, it is that, for a given individual or institution, the emotions of investing have destroyed far more potential investment returns than the economics of investing have ever dreamed of destroying.’
The ’emotional cost’ of investing can, at times, be extremely large. By emotional costs, we mean the impact on returns that are caused by our own actions or inactions (i.e., our behaviour), rather than the markets. The temptation to try to get in (or out) at the right time is huge. Imagine if you could have avoided the 50% market fall during the global financial crisis of 07/08, or the blink-and-you’ve-missed-it COVID crash in early 2020 and bought in again at the bottom. By and large, investors have a woeful track record of timing when best to jump in and out of markets. It is worth remembering that you have to get two decisions right when market timing. The first is when to get out. The second is when to get back in again. The problem is that markets work pretty efficiently at reflecting new information into prices (of e.g. company shares and bonds) quickly, and thus every decision you make is a bet against the aggregate view of all investors trading in the markets. Markets move on the release of new information which is, by its very nature, random.
A well-known piece of research from Morningstar’s ‘’Mind The Gap (2023)’ report estimates this ‘behaviour gap’ between buying and holding a fund and the return an average investor receives as money flows in and out of the fund, to be around -1.7% per year on a large sample of US funds.
Let us look at an example of the ‘behaviour gap’ in action. The chart below shows the fund flows of the largest index fund in the world – the Vanguard Total Stock Index Fund – plotted against the rolling quarterly returns of the fund (in GBP terms). Following the COVID drawdown, negative fund flows persisted in the following months yet the market bounced back and was up 22% by the end Jun-20. This is the behaviour gap in action.
Figure 2: The emotional costs of investing in practice (March 2019-December 2020)
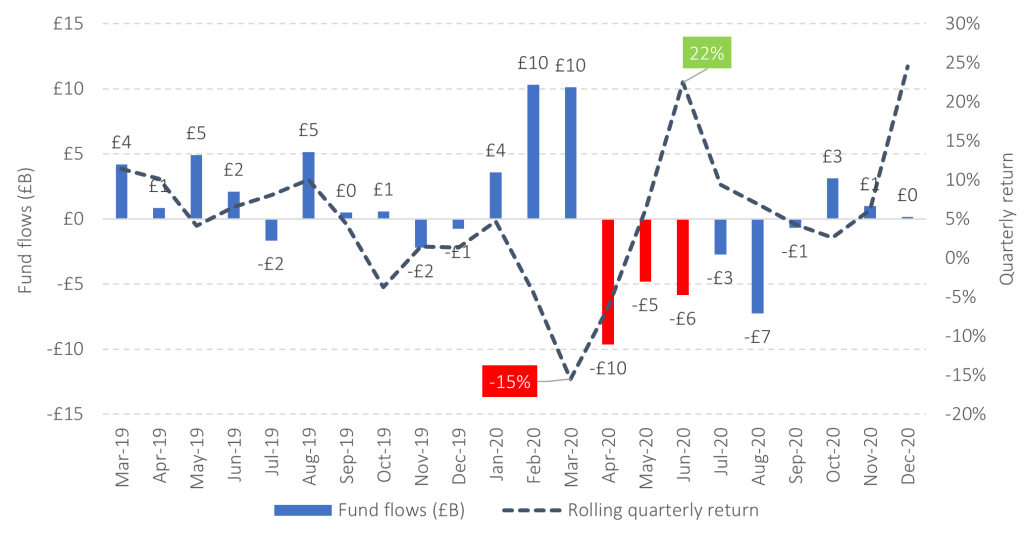
Source: Morningstar Direct © All rights reserved. Ticker: VTSMX
The solution? Own a sensibly diversified portfolio with sufficient higher-quality, shorter-dated bonds to provide protection from portfolio falls, allowing you to stay invested throughout these inevitable episodes of market turmoil that arise from time to time.
Performance over the second quarter (from Friday 29 March 2024 to Friday 28 June 2024)
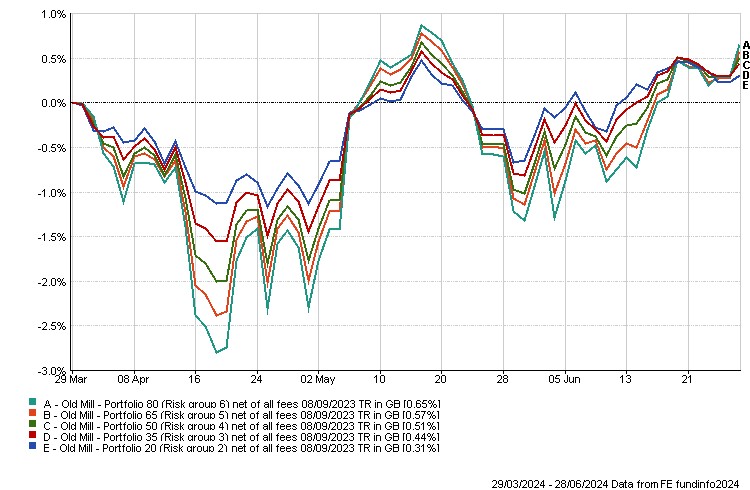
While the path of global markets and therefore portfolios is up, it has not however been a smooth ride. A strong US economy spooked the market in April and forced it to reassess when interest rate cuts might be made by central banks. These investment falls however were reversed through the quarter as global inflation continued to fall.
Performance over the last year (up to Friday 28 June 2024)
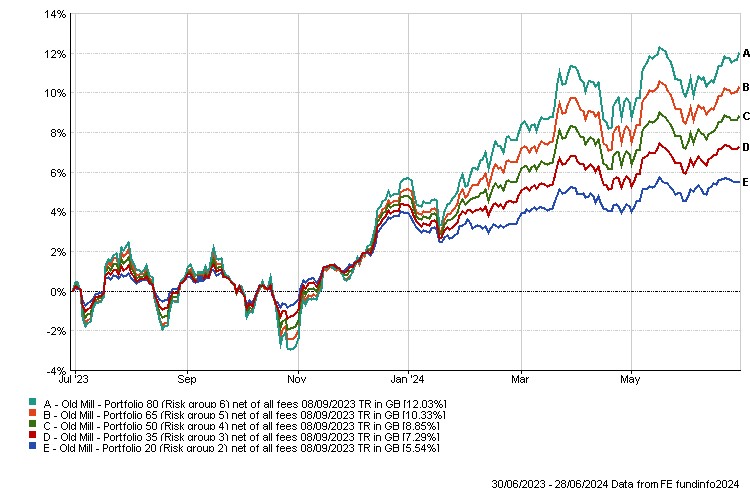
Over the year, all portfolios are showing good performance although as you can see there was a rollercoaster of returns at the end of 2023, depending on the risk profile you chose. As an illustration of stock market returns, although the year was volatile, you needed to be invested to participate in the sharp increase from mid-October.
Longer term performance over the last 10 years (up to Friday 28 June 2024)
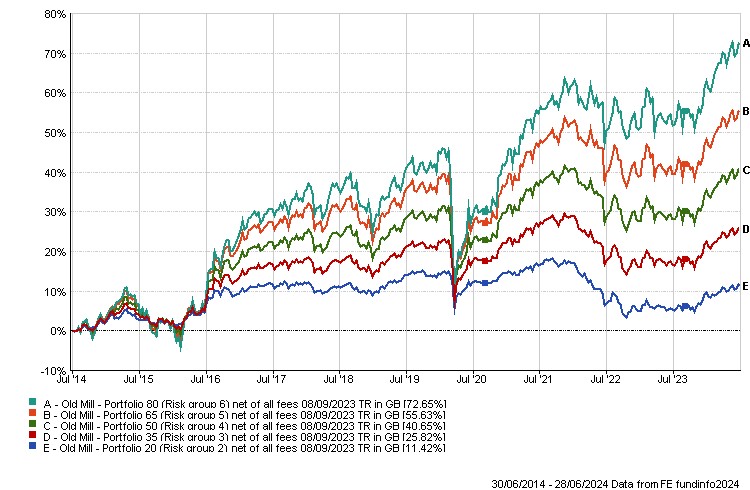
The ten-year returns illustrate the value of investing over the longer term. It also highlights that in pursuing higher returns, there will be periods of volatility that call for patience and trust in the investment process. Nowhere did we see this more than in the early days of the covid pandemic in spring 2020.
There have always been differences in how different firms have described Environmental, Social and Governance (ESG) screened investments – Sustainable, Ethical, Responsible etc. There are new ‘Anti-Greenwashing’ rules which were introduced in May this year to ensure any sustainability-related claims made in all marketing and communications of all products and services are fair, clear and not misleading. This will ensure the defined terms are used consistently and appropriately.
One of these terms is ‘Sustainable’ so we are no longer able to use this. Considering the issues that matter to our clients is important to us, so this solution is for clients who want to take steps to do more to reflect their own values whilst still maintaining a robust investment structure. So, we have renamed the Values portfolio to reflect this.
The Old Mill Values Solution has the objective of growing capital over the medium to long term while also considering values that may be important to you. We invest in a blend of Dimensional and Index funds, some of which screen for several ethical and sustainable considerations to determine the companies invested into. These screens consider exposure above a minimum level to environmental and social concerns and may lead to companies being excluded or restricting investment.
Performance over the first quarter (from Friday 29 March 2024 to Friday 28 March 2024)
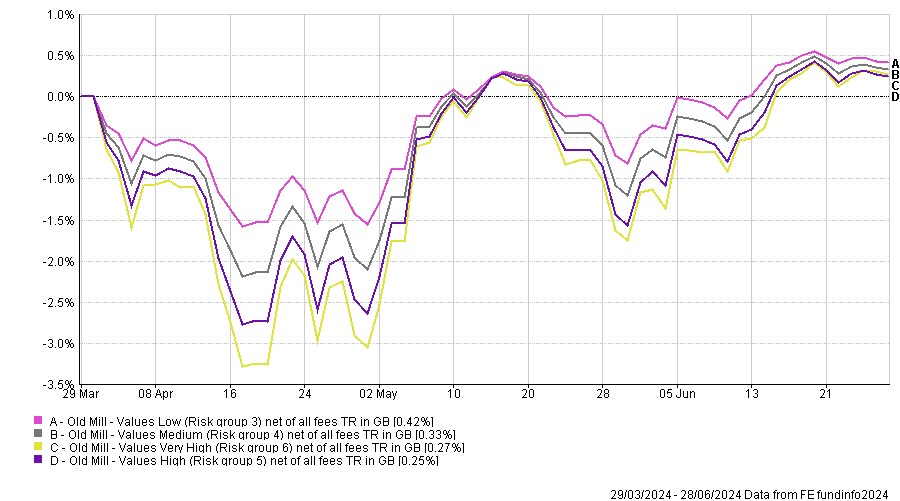
Values portfolios have seen similar returns over the period to standard portfolios.
Performance over the last year (up to Friday 28 June 2024)
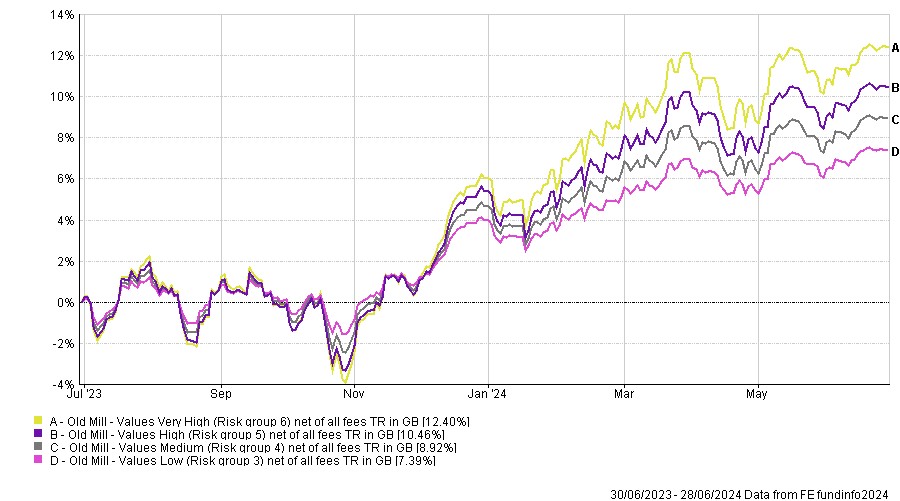
Performance over the last year for values portfolios has been slightly positive when compared to the original portfolios with the ESG screened global equity fund showing strong performance.
Longer term performance over 10 years (up to Friday 28 June 2024)
The values portfolios have only been available to our investors for the last five years, but the graph below shows the longer time frame of ten years showing the potential upside over longer periods.
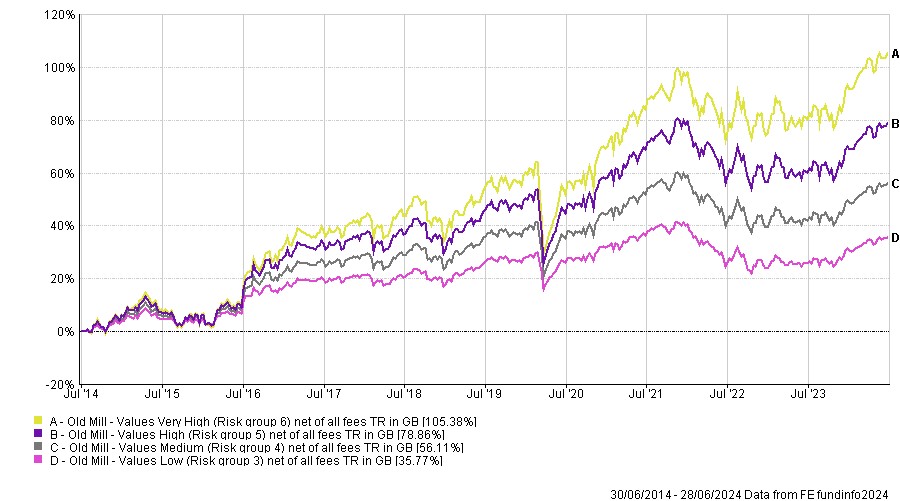
Longer term performance of the values portfolios shows robust growth.
Below shows the performance of a number of asset classes in 2024 so far and the annualised return over the last five years as at close of play on Friday 28 June.
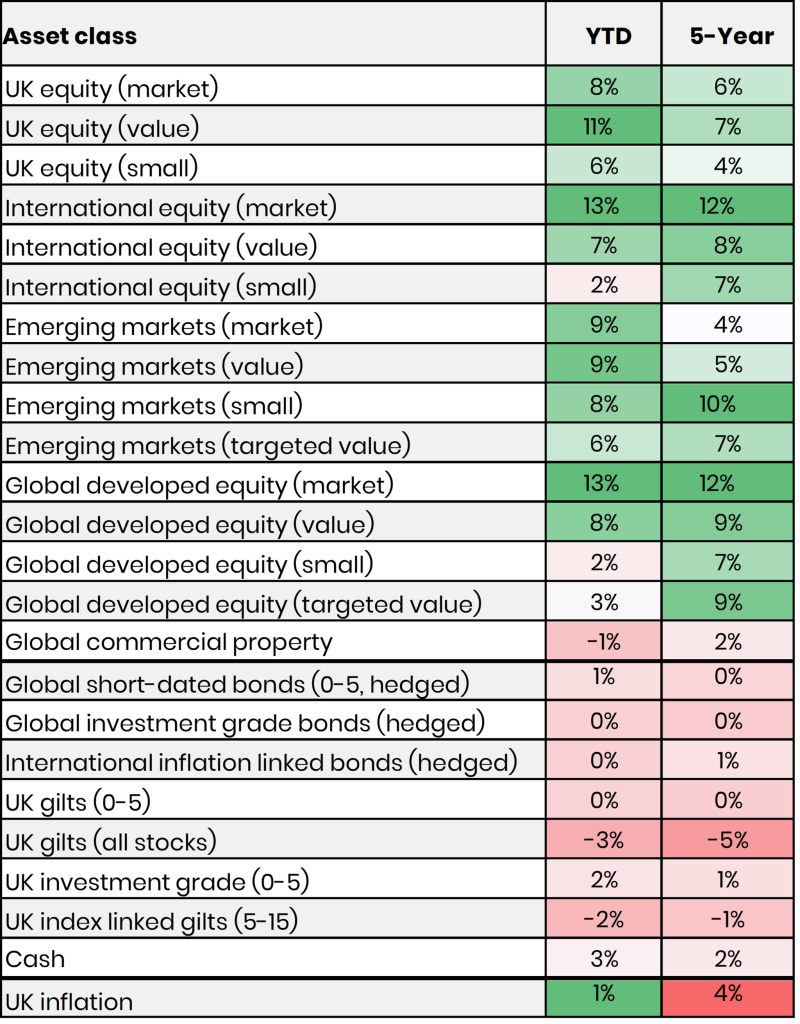
This year has been far more positive in investment terms. As inflation has fallen and markets expect central banks to cut interest rates, this has been taken positively by most asset classes.
We include different equity sectors for the potential of growth over time but there may be periods when we see underperformance. Over the year so far, smaller companies and global property have lagged the strong performance we have seen in global developed market equities. We continue to hold these underperforming sectors as this provides diversification and we would expect different sectors to do well at different times.
In the short term you should expect fluctuations. You can see in the year to date (YTD) column above, the defensive assets such as global short-dated bonds have, whilst positive, had much lower returns than most growth assets.
While inflation has been coming down and expectations are for interest rates to fall, there have been changes to the speed at which this will happen. At the beginning of the year it was thought there would be a number of interest rate cuts, certainly in the US, Europe and the UK but the forecast has changed somewhat with persistent inflation and strong economies, especially in the US. So, interest rates are still expected to come down, but at a slower pace.
We discuss some of the longer-term characteristics of growth assets and defensive assets below.
At its simplest, investment is about capturing the rewards owed to you for providing your capital to others. There are two key ways to do this. The first is by lending your money to a company or government (owning bonds or defensive assets). The second is to provide capital to companies in return for shares and receive the rewards of being a part owner (owning developed and emerging market equities).
Figure 1: Participate in the rewards of capitalism.
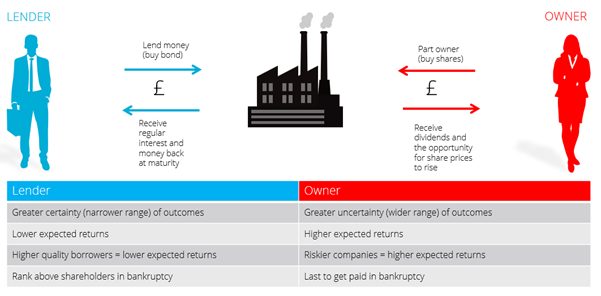
Source: Albion Strategic Consulting © 2024. Data: Morningstar Direct © All rights reserved
The outcomes a bond holder will experience will tend to be much narrower than the outcomes that an owner of shares will experience. It is this greater uncertainty that delivers the higher expected returns of equities over bonds. The figure below compares monthly after-inflation outcomes of shorter-dated, higher-quality bonds against those of global equities.
Figure 2: Equity outcomes are less certain than bond outcomes February 1955 to March 2024.
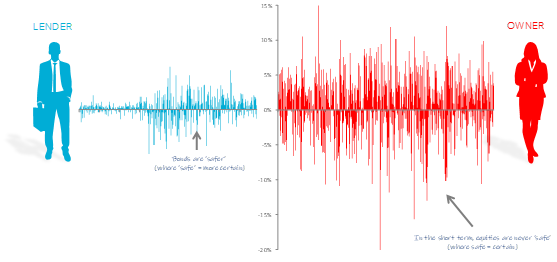
Source: Albion Strategic Consulting © 2024. Data: Morningstar Direct © All rights reserved
If we take each of these after-inflation monthly returns, we can calculate the annualised after-inflation returns (i.e., per annum) that the lenders and the owners would have received over these 69 years or so.
Figure 3: Annualised after-inflation returns (% p.a.) of lending and ownership February 1955 to March 2024.
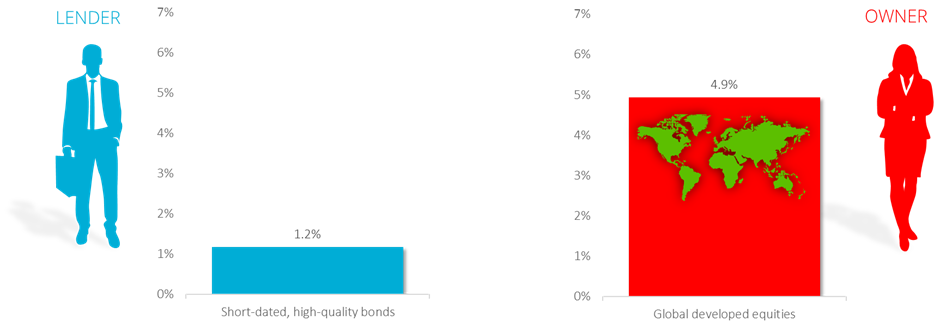
Source: Albion Strategic Consulting © 2024. Data: Morningstar Direct © All rights reserved
As you can see from the figure below – using these numbers – £100 invested in the equity of companies grew to more than £2,800 in purchasing power terms. On the other hand, as a lender £100 became £225. Due to the power of compounding over time, what seems to be a four-fold difference between the rewards of being a lender and those of being an owner, ends up as a more than twelve-fold difference over the period.
Figure 4: Growth of £100 of purchasing power from lending and ownership February 1955 to March 2024.
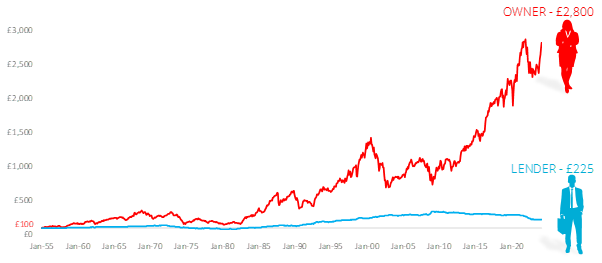
Source: Albion Strategic Consulting © 2024. Data: Morningstar Direct © All rights reserved
Conclusion
The key to successful investing is to get the balance between bonds and equities right, given your circumstances. While we can plainly see that holding equities offers higher returns over time, the graph also shows that these investments can fall sharply at times, most recently during the Covid pandemic. Bonds are a very important part of most investors’ portfolios at these times, providing protection for portfolio values.
In or out of growth or defensive investments is the impossible question. It is easy to look back knowing what we do now but a little more difficult to look forward and see what the future brings! We think a better way of investing is identifying the falls in value you would remain comfortable experiencing and tailoring your portfolio accordingly.
Thereafter you want to pick up as much of the return on offer by investing in low-cost, systematic funds seeking to deliver market returns. Finally, it requires patience and fortitude to weather any market storms along the way. The rewards of capitalism are there for those who can wait.