
Investment performance - Quarter one 2024
Investing, as we have often reported, is a long-term pursuit but while we regularly look at shorter term performance in this publication, how should you compare how we perform with what you may achieve elsewhere?
11th April 2024
-
 Gavin Jones See profile
It is fair to say that in more recent times, the investment climate has been challenging. Perhaps last time you met with your Old Mill financial planner for your annual review, the return on your portfolio was disappointing and it is entirely reasonable to question whether your portfolio is still the best place for your wealth.
Last year, with poor returns from portfolios and interest rates rising, you may have been tempted to invest new money on deposit, or even to take money out of your portfolio. We talk about the long-term nature of investment returns, but the last five months illustrate very clearly that market returns when they come can be large and swift as the chart below shows.
Performance over the last five months (from Monday 27 October 2023 to Friday 29 March 2024)
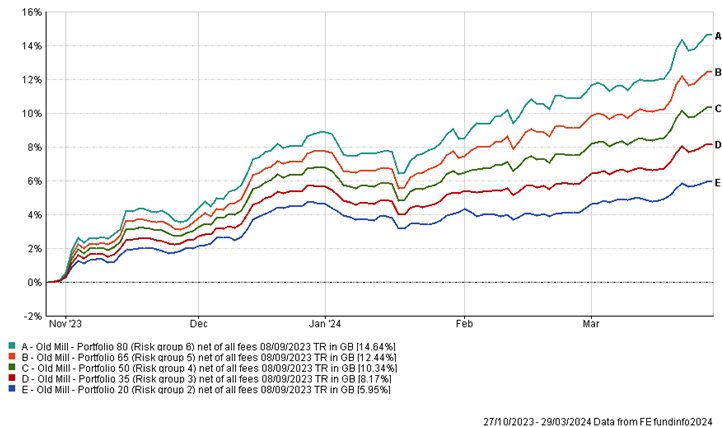
Of course, this is only a snapshot of a short period of time, however it illustrates that those who trust in the investment process and are prepared to be patient should be rewarded over time.
Other investment manager comparison
For most of our clients the investment period is often a long time. We have shown previously the historic performance of our portfolios against similar investment managers. The graph below shows this from 1 April 2011 to the end of 2023. The orange dots show the performance of each of our portfolios.
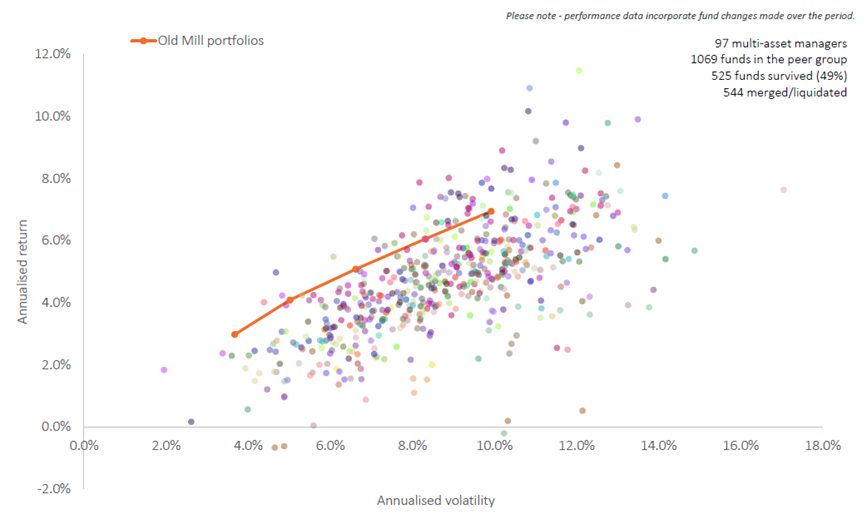
Source: Morningstar direct
What the table below shows is how the returns from each of our portfolios compares to funds from investment managers taking a similar level of risk.
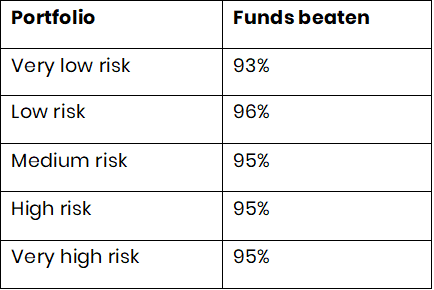
This should provide reassurance that our portfolios compare extremely favourably against other similar funds.
Tax and your portfolio
Historically, as part of managing your portfolio we have endeavoured to minimise Capital Gains Tax (CGT) payable on any investment gains, whilst ensuring you remain aligned to your risk profile. However, if you have investments outside of pensions and ISAs the reduction in the CGT annual allowance to £3,000 for this tax year may mean it is more common to pay CGT in the future. The CGT rates you pay are half that of income taxes: 10% for basic rate taxpayers and 20% at the higher rate.
As a result of the much-reduced annual allowance there may be unintended consequences if we try and avoid paying CGT on gains in future. As you know we rebalance portfolios back to your original risk profile each year. If we do not do this, the resulting differences in investment performance could easily outweigh any tax saving.
Your Old Mill financial planner will be able to discuss this at your annual review.
Performance over the first quarter (from Monday 1 January 2024 to Sunday 31 March 2024)
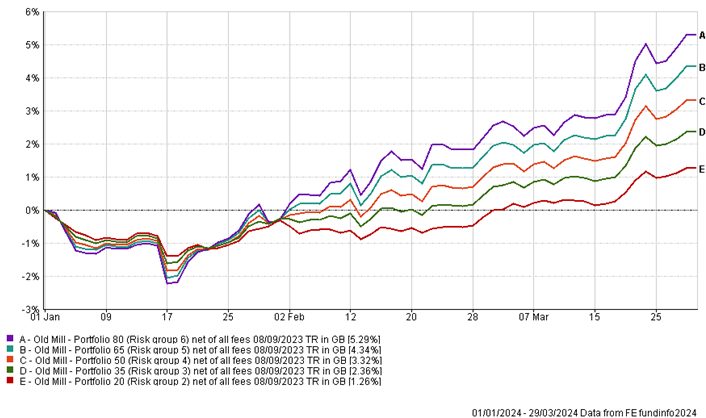
Despite some weakness in January, portfolios again showed healthy growth over the quarter as equity markets were positive and bonds benefitted from higher yields.
Performance over the last year (up to Sunday 31 March 2024)
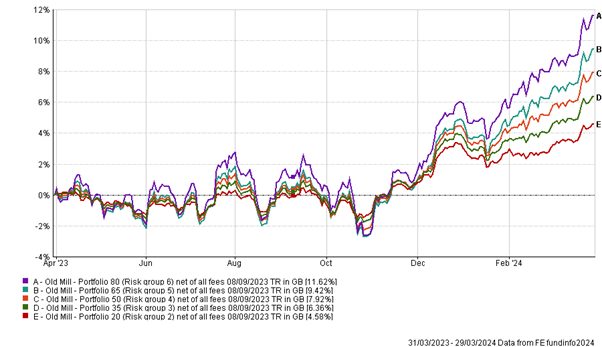
Over the year portfolios are showing positive performance although as you can see there has been a rollercoaster of returns, depending on the risk profile you chose. As an illustration of stock market returns although the year was volatile, you needed to be invested to participate in the sharp increase from mid-October.
Longer term performance over the last 10 years (up to Sunday 31 March 2024)
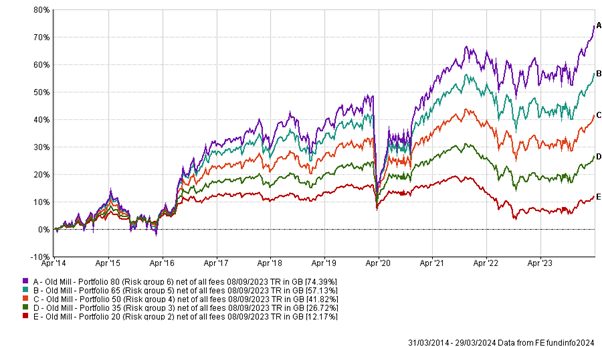
The ten-year returns illustrate the value of investing over the longer term. It also highlights that in pursuing higher returns, there will be periods of volatility that call for patience and trust in the investment process. Nowhere did we see this more than in the early days of the covid pandemic in spring 2020.
Performance over the first quarter (from Monday 1 January 2024 to Sunday 31 March 2024)
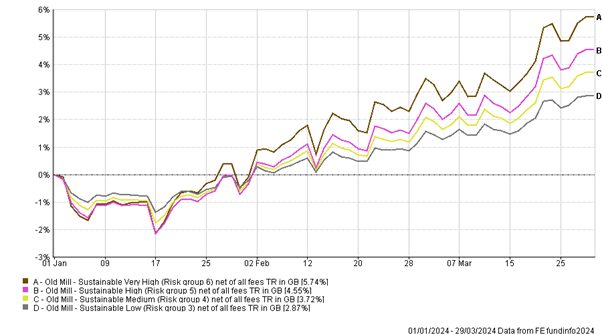
Sustainable portfolios have seen similar returns over the period to standard portfolios.
Performance over the last year (up to Sunday 31 March 2024)
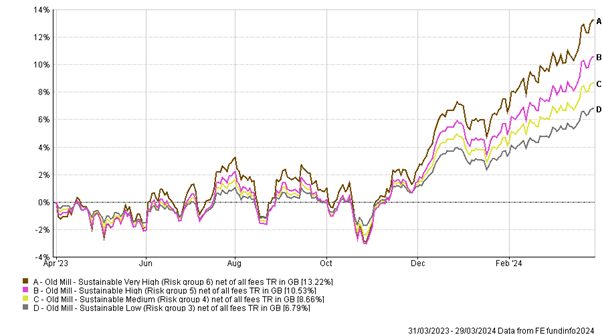
Performance over the last year for sustainable portfolios has been positive when compared to the original portfolios with the ESG screened global equity fund showing strong performance.
Longer term performance over 10 years (up to Sunday 31 March 2024)
The sustainable portfolios have only been available to our investors for the last five years, but the graph below shows the longer time frame of ten years showing the potential upside over longer periods.
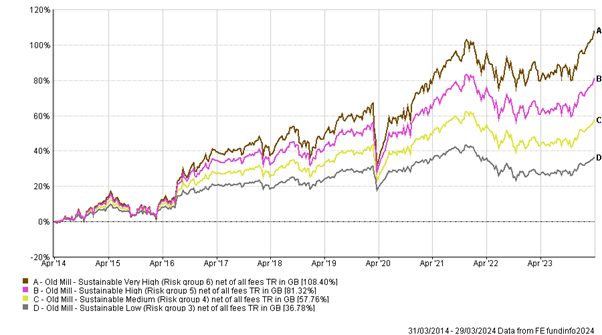
Longer term performance of the sustainable portfolios shows robust growth.
Below shows the performance of a number of asset classes in 2024 so far and the annualised return over the last year as at close of play on Sunday 31 March.
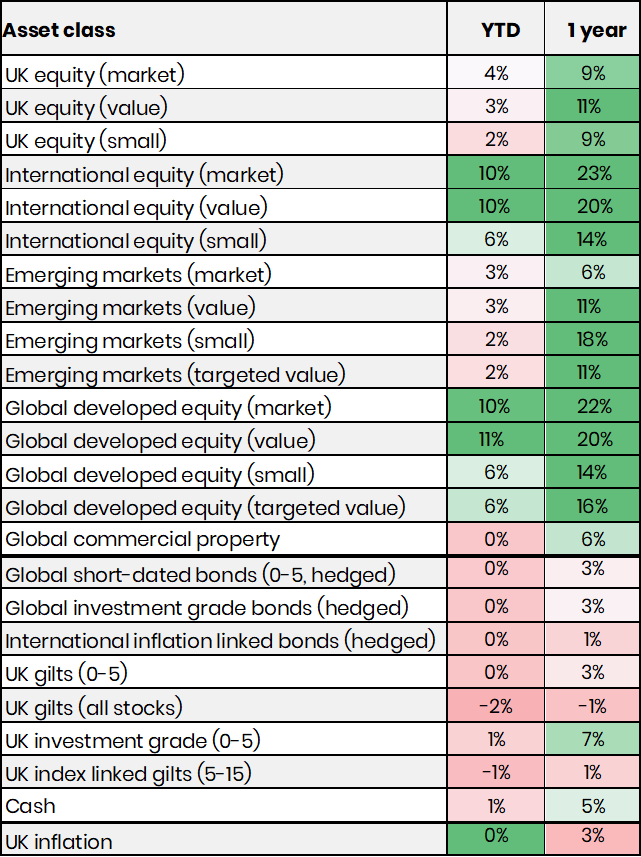
The last year has been far more positive in investment terms. As inflation has fallen and markets expect central banks to cut interest rates this has been taken positively by most asset classes.
We include different equity sectors for the potential of growth over time but there may be periods when we see underperformance. Over the last few years Emerging Markets and Global property have lagged the strong performance we have seen in global developed market equities. We continue to hold these underperforming sectors as this provides diversification and we would expect different sectors to do well at different times.
In the short term you should expect fluctuations. You can see in the year to date (YTD) column above the defensive assets such as global short-dated bonds have been flat as markets price in that global interest rates may not be cut as quickly as it was thought at the beginning of the year.
Please contact your Old Mill financial planner if you would like to discuss the performance of your portfolio.