
Performance of the Old Mill Portfolios
9th November 2023
-
 Gavin Jones See profile
Performance since the last insight (from Friday 29 September 2023 to Friday 3 November 2023)
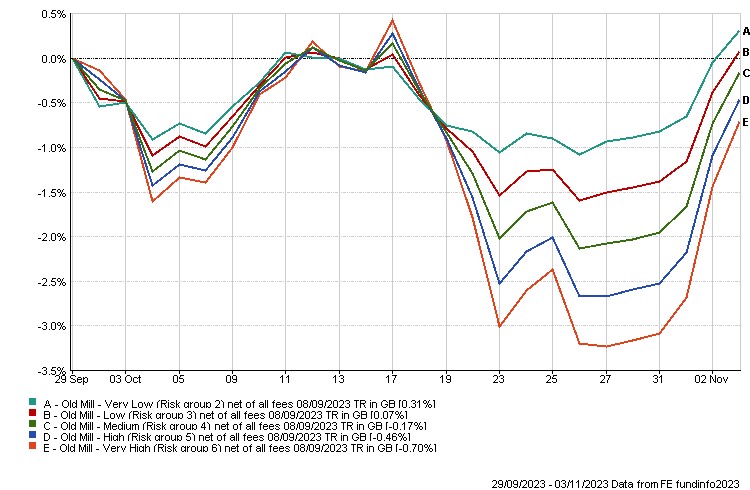
The beginning of November saw the strongest rally in US equities for a year as bond markets concluded that the US may have reached its peak interest rate for the time being. After falls for portfolios through October on fears of higher interest rates and fall out from the Gaza situation this meant most portfolios were still slightly lower at the end of the period.
Performance over the last year (up to Friday 3 November 2023)
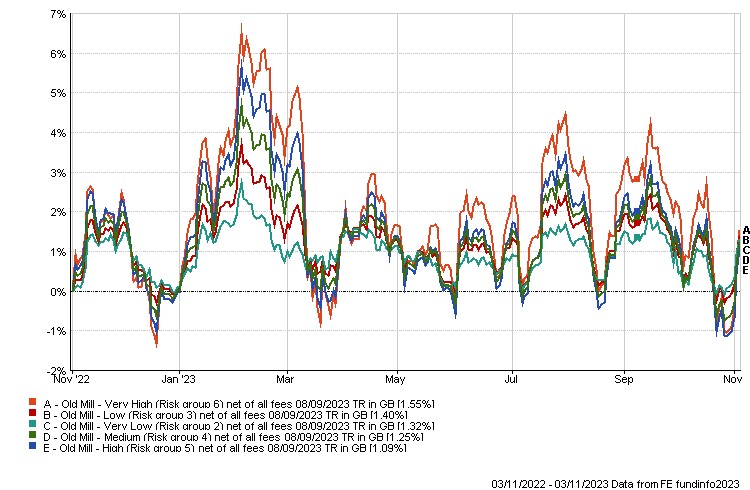
While most portfolios are reasonably flat over the year, you can see from the one-year graph that market movements can be swift, in both rising and falling markets. As risk and return are related it is this uncertainty that means investors should be compensated for holding higher risk assets and they should provide a good inflation plus return over time.
Longer term performance of standard portfolios (up to Friday 3 November 2023)
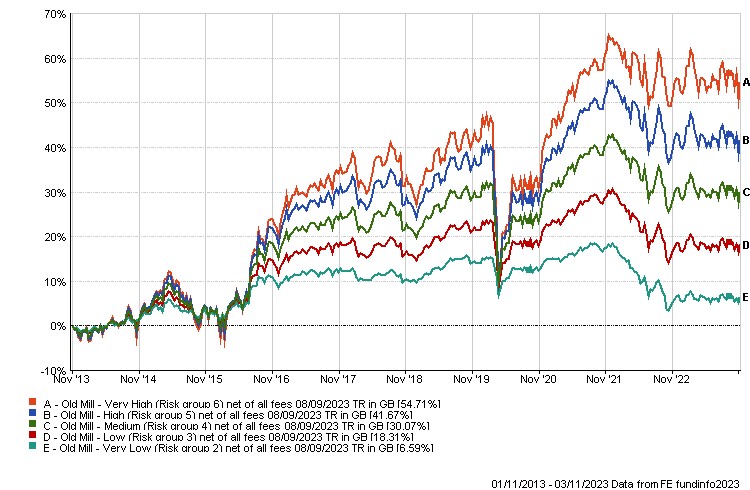
Investing remains a longer-term pursuit and taking a look at the ten-year graph to the beginning of November, the portfolios are showing a more robust picture depending on the level of risk you have taken. Returns ultimately are a function of taking risk over the longer term.
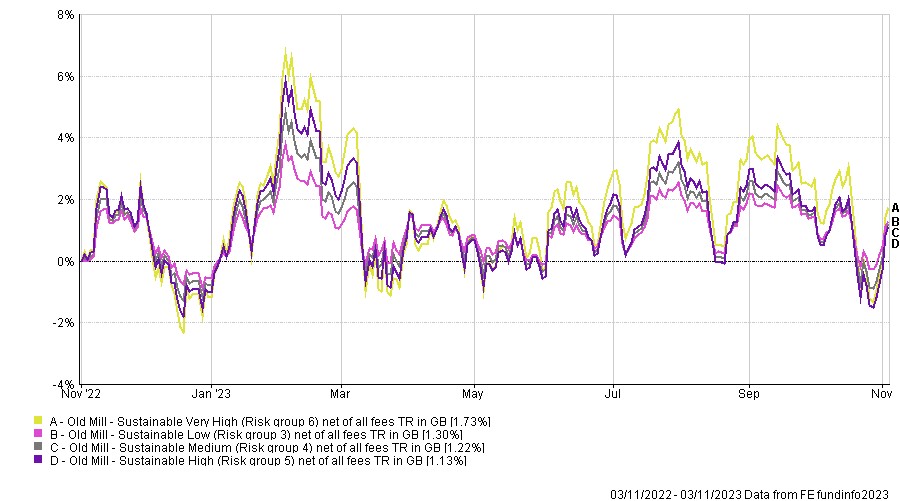
Sustainable portfolios performance since the last insight (from Friday 29 September 2023 to Friday 3 November 2023)
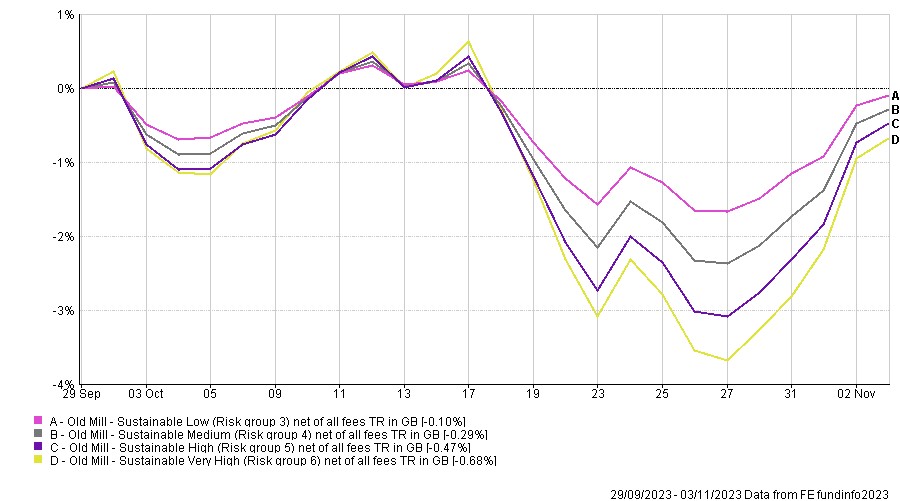
Sustainable portfolios performance has lagged standard portfolios over the period primarily due to the exclusion of many oil and gas companies.
Performance over the last year (up to Friday 3 November 2023)
Performance over the last year to the beginning of November for sustainable portfolios has been similar to the original portfolios.
Longer term performance of Sustainable portfolios (up to Friday 3 November 2023)
The sustainable portfolios have only been available to our investors for the last five years, but the graph below shows the longer time frame of ten years showing the potential upside over longer periods.
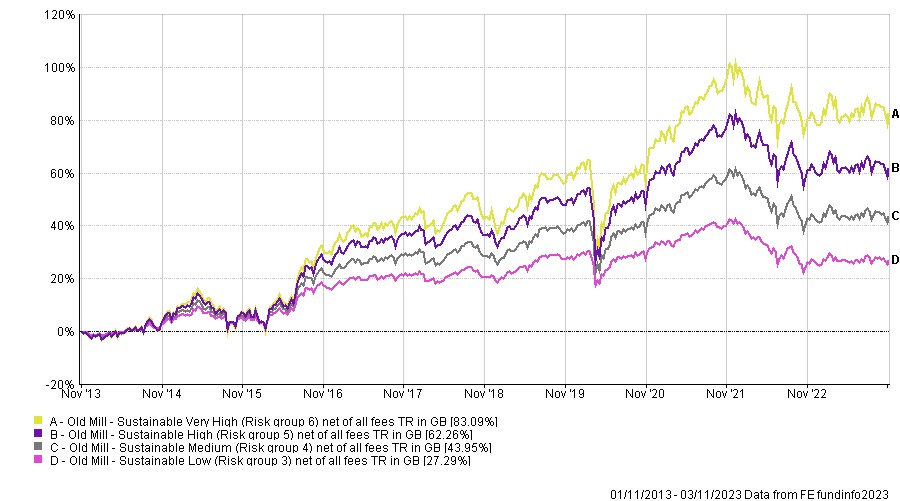
Longer term performance of the sustainable portfolios shows robust growth, although you can see from the graph the impact of rising inflation and interest rates from November 2021.
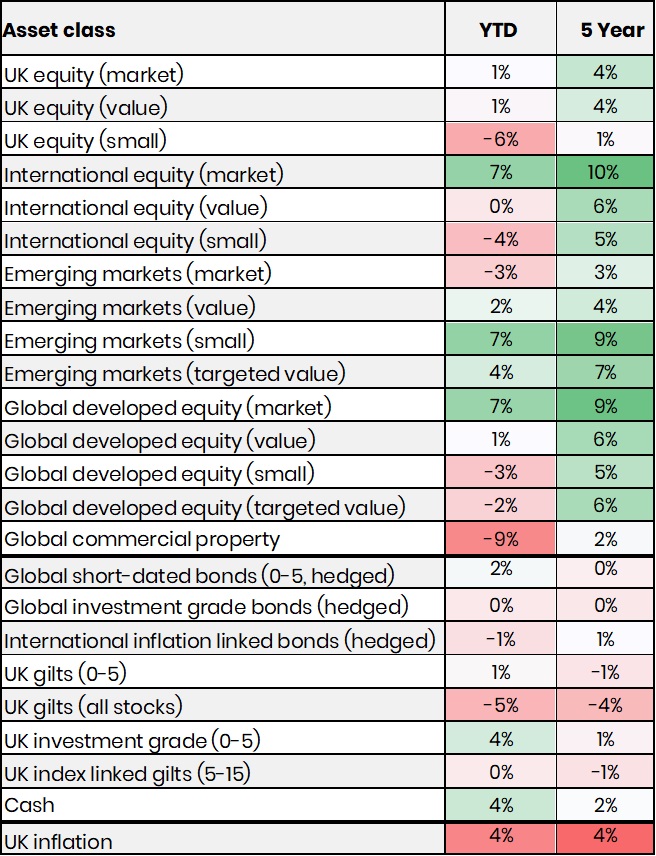
Below shows the performance of a number of asset classes for the last year and the annualised return over five years as at close of play on Friday 3 November.
Please speak to your financial planner if you wish to discuss your portfolio.