Performance of the Old Mill Portfolios
Global equity markets have fallen in 2022 but not in a uniform manner. Of note, high growth stocks such as Netflix (down 71% ytd) or Meta (formerly Facebook, down 53% ytd) have been particularly hard hit, impacting the broad US market (down 18%) and the tech-oriented Nasdaq (down 28%). Yet, global markets, in GBP terms, are down only 10% or so.
Sterling’s recent fall against the dollar has helped your portfolio, as the overseas assets held now buy more Pounds. The UK equity market is more-or-less flat. It is worthy of note that a well-constructed exposure to global value stocks, which is also in our portfolios, has delivered gains of nearly 4% so far this year, from which diversified investors will have benefited. A similar value outcome has been seen in your emerging markets exposure.
Over the longer time horizon that most investors face, equity assets should provide inflation-plus returns to protect the value of wealth. Unfortunately, there are no certain inflation hedges.
24th June 2022
-
 Gavin Jones See profile
The fears of inflation have pushed bond yields higher, with resultant falls in bond prices. Shorter-dated, higher quality bonds – favoured in our portfolios – have been impacted to a lesser degree than long-dated bonds. As an example, short-dated UK gilts are down 1.5%, whereas a portfolio of all UK Gilts is down a little over 10%. The positive is that – going forward – bonds are now yielding materially more than a year ago with yields of about 3% with an average duration just over three years. These defensive assets are hedged back into Sterling to avoid the volatility associated with currency movements.
All-in-all, a well-diversified global equity portfolio, with exposure to value stocks and holding shorter-dated high quality bonds, has probably been more solid than the news might suggest, and performance certainly sits well within the bounds of expectation.
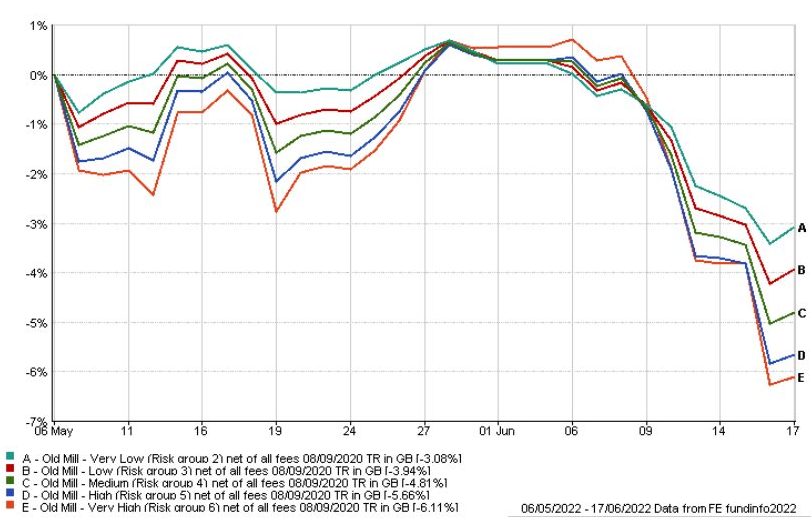
Core Portfolios – Performance since the last insight (from Friday 6 May 2022 – Friday 17 June 2022)
Defensive assets have been under pressure this year, but in the falls we have seen since the beginning of June (shown in the graph below) you can see the lower risk groups have fallen less against the greater ups and downs of growth assets in higher risk groups.
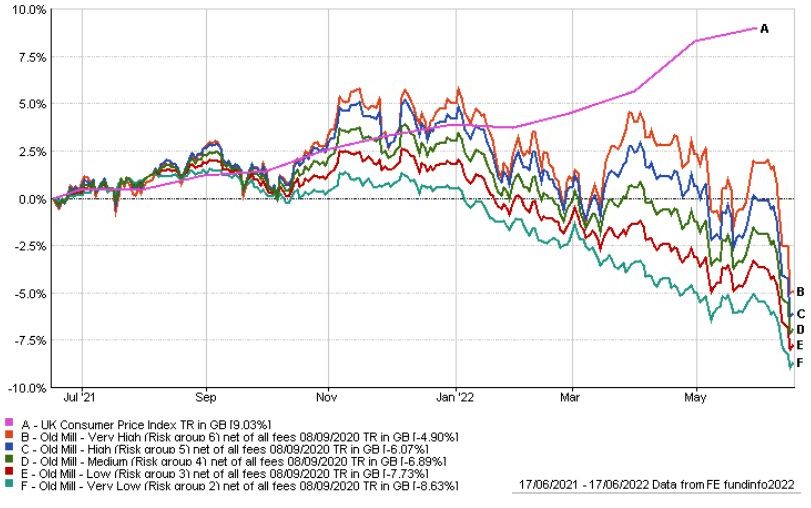
Core Portfolios – Performance over the last year (to Friday 17 June 2022)
As you can see in the graph below, we have seen falls in all portfolios over the last year in the face of global economic and political turmoil and rising inflation which we agree is disappointing but is within expectations. Lower risk portfolios with their greater proportion of fixed interest – predominantly short dated high-quality bonds, have also fallen, but these defensive assets will now have much higher annual yields. Headwinds against the portfolios have been high with pressure on both growth assets as well as defensive assets but movements are still within the parameters we should expect from time to time. With an all-duration gilt index and global equities in general down over 15% since the beginning of the year the portfolio diversification has helped.
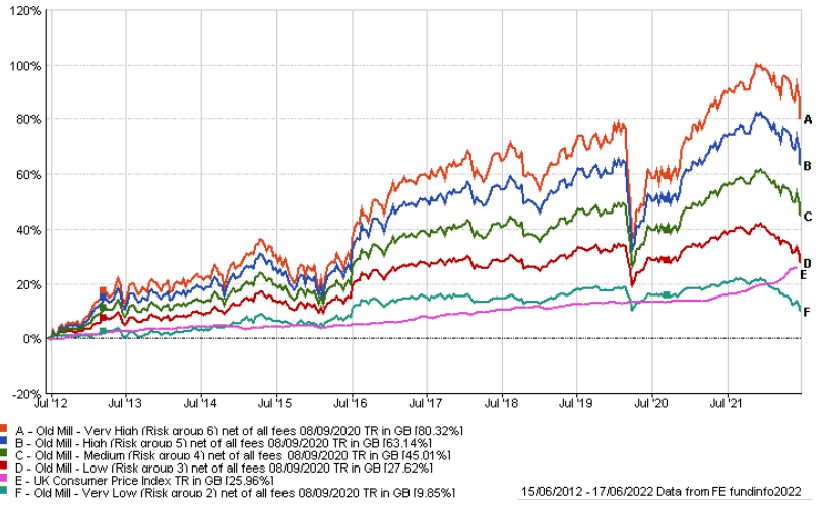
Core Portfolios – Performance over the longer term
Investing is a long term pursuit and while we can look at short term performance to explain what you are experiencing, we hope you take reassurance from the longer term results (as shown in the graph below).
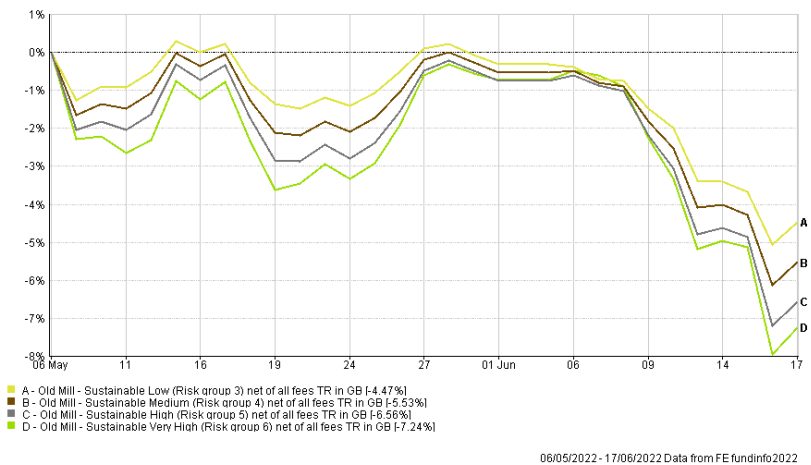
Sustainable Portfolios – Performance since the last insight (Friday 6 May 2022 to Friday 17 June 2022)
As shown in the graph below, our sustainable portfolios saw greater falls through June with the US stock market and growth stocks, which forms a greater percentage of the sustainable portfolios (30%) than in the standard portfolios (20%) seeing an impact from rising interest rates.
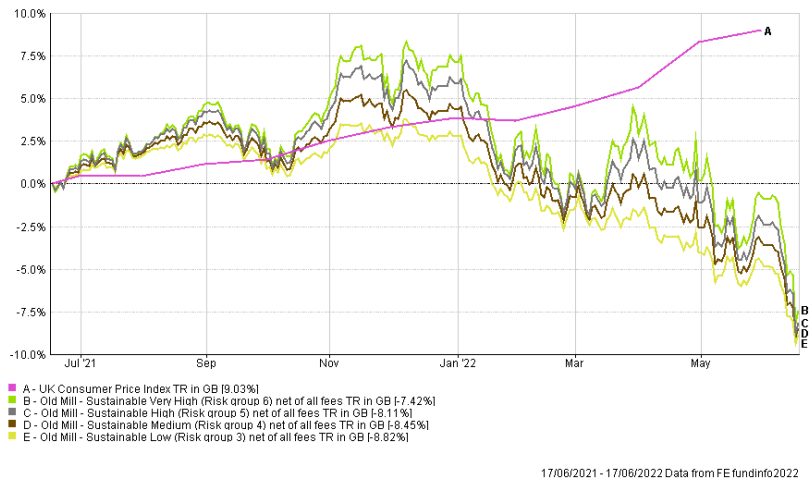
Sustainable Portfolios – Performance over the last year (to Friday 17 June 2022)
Investments in the sustainable portfolios exclude a number of industries to reduce the exposure to carbon emissions. One of the impacts of this over the year has been little or no exposure to energy industries such as oil and gas which have seen strong performance in the face of the Ukraine war which has impacted performance.
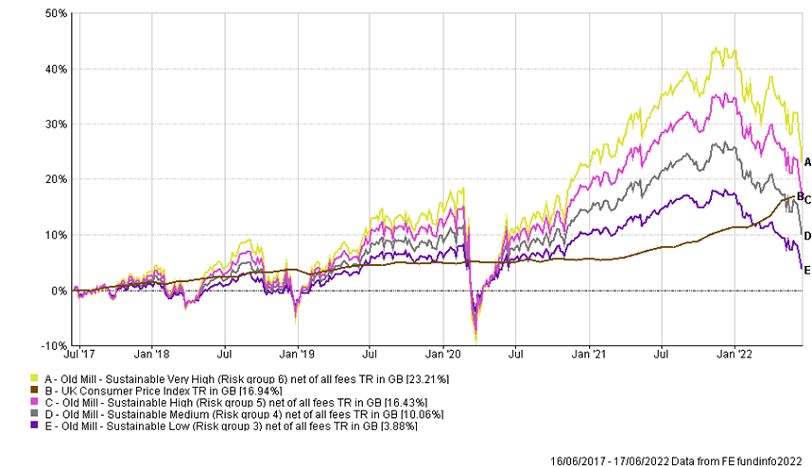
Sustainable Portfolios – Longer term performance
As the sustainable portfolios have only been available for the last five years this is a shorter timeframe than for the Core Portfolios, but still showing the potential upside over longer periods in the graph below.
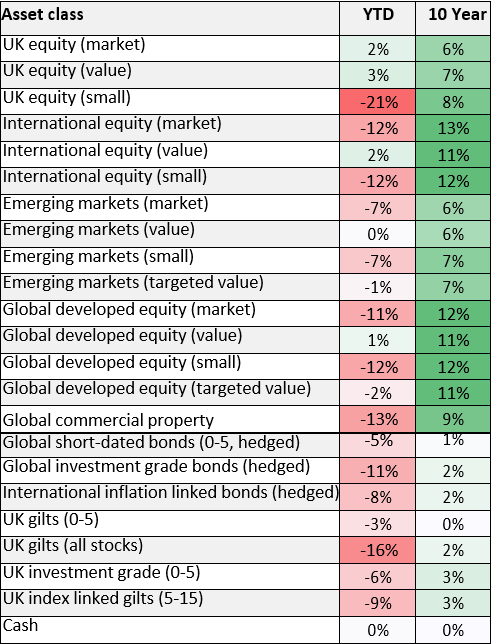
Portfolio Investments
Below shows the performance of a number of asset classes for the year to date and over the last ten years as at close of play on Monday 13 June.
Looking at the underlying asset classes this reinforces the short term pressure investments have been under but also the higher returns available over longer time periods.