
Politics and portfolios
It feels like 2024 is the year of the election with over 64 happening in various countries around the world covering around 50% of the world’s population[1]! These range from the farcical pretense of the re-election of Putin, to that in the UK. At this time, it looks like a probable victory for the Labour party over the incumbent Conservatives, seemingly with a large majority.
[1] TIME (2023) The Ultimate Election Year: All the Elections Around the World in 2024. https://time.com/
17th June 2024
-
 Gavin Jones See profile
In the previous election in 2019, British politics was polarised between Boris Johnson’s ‘getting Brexit done’ mantra and a very left-wing alternative of Jeremy Corbyn and his ‘magic money tree’. Today, the two main parties are vying for far more central ground.
The EU Parliament elections earlier in June have caused concerns over the growing impact of the far-right across Europe. In France, Emmanuel Macron has dissolved the French parliament and called a national election after the far-right National Rally party (RN) in France gained more than double the votes of his own Renaissance party in the EU vote. Throw in the US election chaos in November and you might wonder how to process all of this in terms of what might happen to your portfolio.
Well, the good news is that the markets have done this already for you! It is no doubt, for example, pricing in the probability of a Labour Government and what it thinks about its policies, as far as they are known. That is what markets do. They incorporate all public information into prices quickly and efficiently, meaning that prices only move on the release of new information, which is random. The stock market tends to be resilient for those with the patience to sit out any passing market storms.
It seems to be obligatory at these times to roll out a chart with the colours of the different parties indicating the periods they are in power – red for Labour and blue for Conservative – and showing the growth of the market. It does not tell you much, apart from these events have little impact, as the market prices in events well before they happen. So here it is.
Figure 1: The UK market’s growth of wealth over time, irrespective of who is in power.
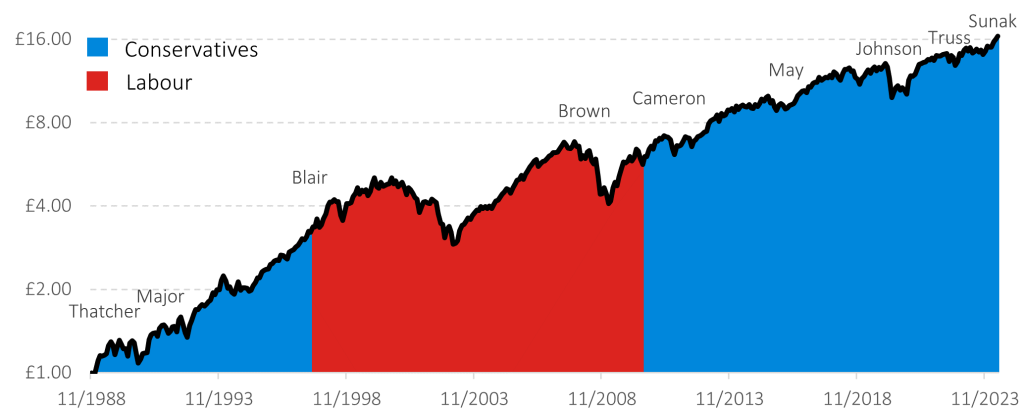
Source: Albion Strategic Consulting. Data: CT FTSE All-Share Tracker 1 Inc (GB0008464199) from 01/10/1988, Vanguard FTSE UK All Shr Idx Unit Tr£Acc (GB00B3X7QG63) from 01/01/2010. Not a recommendation. Data in GBP in nominal terms. Election results data from House of Commons Library.
It really is pointless to try to predict an outcome any different to that already reflected in today’s market prices as the reality is that it is really hard to outguess the market view reflected in prices.
As you see from the figure above, these periods of political power are plotted against the UK market. But what does that tell you? Over 80% of the earnings of the UK market come from overseas, so how meaningful is it to just look at UK politics? Not only that, but the UK is likely to represent only a fraction of your global portfolio, as it only represents around 4% of total world market capitalisation. So, you will need to factor in all 64 elections, all other world events known and as yet unknown and decide how to position your portfolio accordingly.
Alternatively, you could be patient, trust that the markets work well and reflect the aggregate view of all investors and believe in the power of capitalism to deliver rewards due to you as the part owner of companies (equities) and as a lender (bonds). This unsurprisingly is the approach we recommend.