
Quarter 1, 2026 – Investment Performance Report
15th April 2026
-
 Gavin Jones See profile
Performance of our standard portfolios
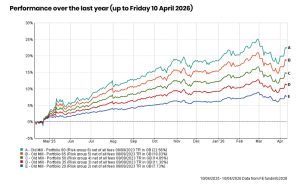
Over the year, despite recent events, we are pleased to report that all portfolios are higher. This may be surprising to some of you based on the headlines in the media and serves to highlight how media coverage of events can sometimes be misleading. Reading disturbing news reports about falls in stockmarkets can lead to unnecessary anxiety for investors. You will have heard the message from us before to focus on the longer term for your investments and not just the performance over the past few weeks.
For those prepared to take on more investment risk, the rewards have been good double digit increases in the last twelve months but for those more cautious there has also been a good return.
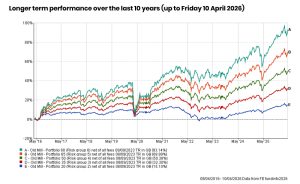
The 10-year returns illustrate the value of investing over the longer term. It also highlights that in pursuing higher returns, there will be periods of volatility that call for patience and trust in the investment process. Nowhere did we see this more than in the early days of the Covid pandemic in spring 2020 as the chart above aptly highlights.
Performance of our Values portfolios (previously Sustainable portfolios)
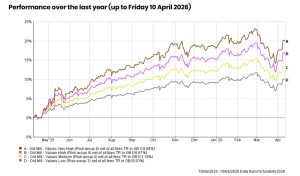
Performance over the last year for values portfolios has been similar to the standard portfolios showing the ability to reflect investors values in portfolios while still generating a good investment return. Growth in values portfolios has been marginally lower over the year as the top performing sector in the short term has been energy. Our values portfolios screen companies for their carbon emissions and the main impact of this is they exclude the big oil companies. As the price of oil has increased due to the situation in the Middle East, this has caused the share price of oil companies to rise which has meant marginally lower growth in the values portfolios.
Longer term performance over 10 years (up to Friday 10 April 2026)
The values portfolios have only been available to our investors for the last five years, but the graph below shows the longer time frame of ten years showing the potential upside over longer periods.
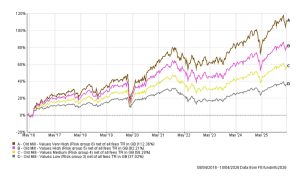
Longer term performance of the values portfolios shows robust growth. The last ten years have seen strong performance from growth assets, especially US equities, even taking into account the Covid pandemic five years ago and the return of inflation after the Russian invasion of Ukraine at the beginning of 2022.
Portfolio Investments
The table below shows the performance of a number of asset classes in 2026 so far and the return over the last year as at close of play on Monday 30 March 2026.
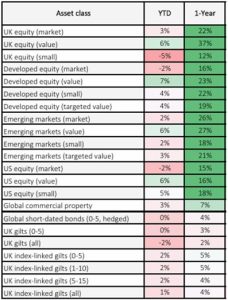
The picture over the last year for growth assets has been strong with good performance seen across equities. We have also shown the asset returns since the beginning of 2026, and despite the situation in the Middle East, many areas are still seeing positive returns.
We were reminded of the benefits of diversification with some of our tilts – to Emerging Markets and Value stocks performing well. Portfolios as a whole saw good returns over longer periods.
Despite the concerning news flow since February, while global markets are lower year-to-date in GBP terms, your portfolio benefits from Value, smaller companies, emerging markets and commercial property. All of these have delivered gains and remain higher since the beginning in 2026, offering helpful diversification. High-quality bonds have also held up well. A diversified portfolio is designed to provide exposure to different sources of return so that no single event determines the outcome. The graph below illustrates this as you can see from the black bars which shows asset performance in 2026 to 30 March.
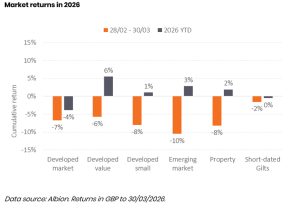
Returns since the beginning of the conflict, shown above in the orange bars are, as expected, noisier. A handful of trading days during a geopolitical shock rarely provide meaningful insight. Markets are simply repricing risk as new information becomes available, and they will continue to do so.
Events such as these can tempt investors to question whether they should do something. The short answer is that they should not. Periods of market stress – whether caused by conflicts, pandemics, political upheaval or economic surprises – are a feature of investing, not a bug. They feel uncomfortable, but they are expected.
The chart below demonstrating that “every year the market falls” is a powerful reminder. Even in strong years, intra-year declines are entirely routine. Falls of 10% or more happen with regularity. Investors who remain disciplined, diversified and patient have historically been rewarded with returns well above inflation over time. Volatility is not an anomaly; it is the mechanism by which long-term returns are earned.
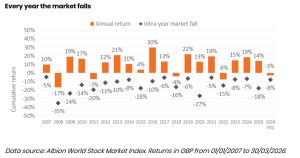
As an example from last year, the black diamond shows that at the time of President Trump introducing global tariffs, global stockmarkets fell by 18% at their lowest point. But then recovered and the orange bar shows the market finished the year 14% higher than it started.